Tables have evolved during the age of HTML. Nowadays it is more reasonable to make the difference between tables and data grids (aka data tables). A table is a visual data arrangement with rows and columns whereas a data grid is a table formatted arrangement of complex data and behavior. For example, in data grid you typically can search, filter, select, etc. data. You often see also actions for the data items – either single or bulk actions…
Designing data grids is not easy, and there is no single correct design that would fit for all use cases. The correct design is what fits for the purpose. However, there are some common features which I expect to see in a well-designed data grid. Also, many of designs out on the internet have decent design and user experience. But to me many of the implementations are not really outputs of a design process. So I wanted to design one of my own.
Data grid layout follows the design that I have found working well: it has header, menu and/or app bar, footer, left section, middle section, and right section. Left section is reserved for navigation where as right section is reserved for actions and/or details. The middle section is where the data will be located. As depicted in the image, there will be also optional part that is reserved for options depending on the context.
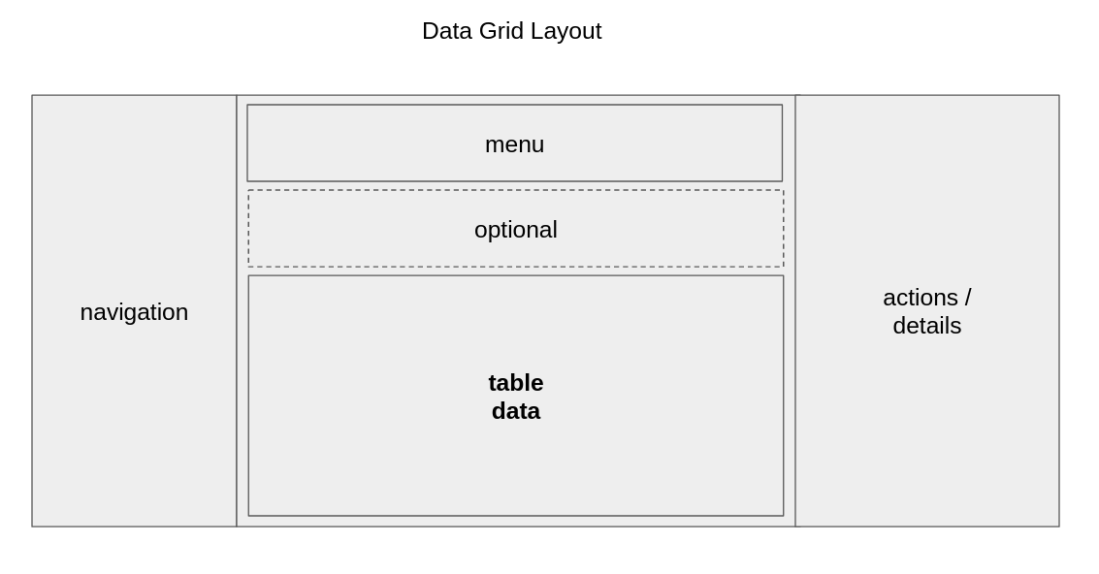
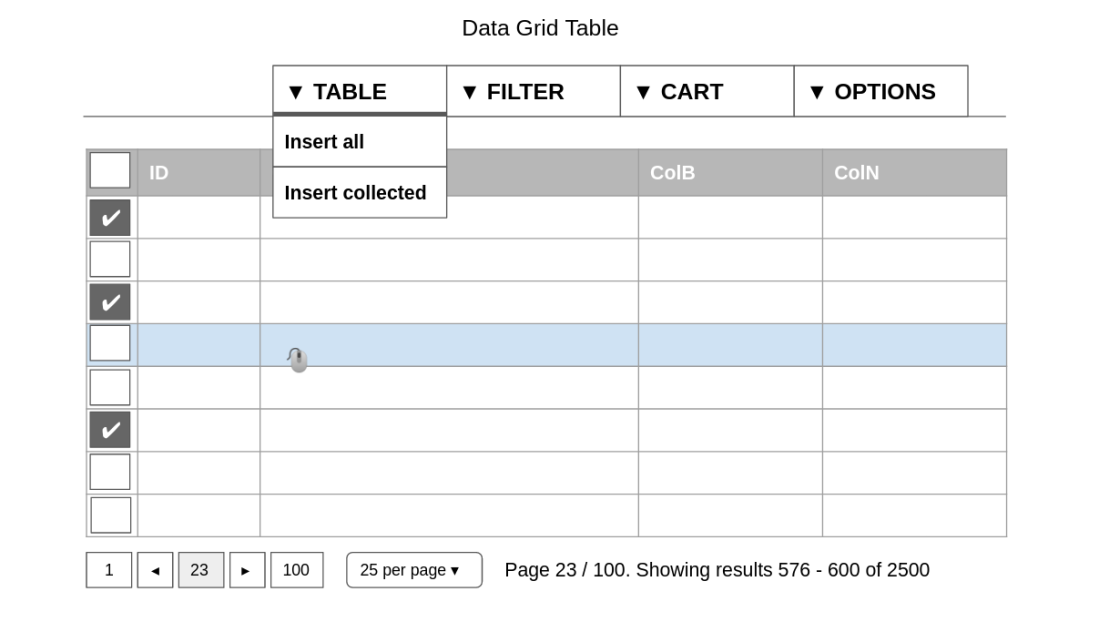
Table data is one part of the layout. Let’s concentrate on to it next. There are tabs:
- TABLE tab for viewing and selecting all data
- FILTER tab for searching, filtering and selecting all data
- CART tab for viewing selected data. User can insert and remove data (rows) from different views: the analogy would be shopping cart in web shops
- OPTIONS tab for extra functionality
There are some important design choices too
- Any row in any tab should NOT contain buttons or actions although it is a fairly typical approach. IMHO, it leads into bad UX. However, it is totally okay to have links – especially text format links. Actions should be displayed the right section (as discussed earlier). The analogy for actions is that you can think of it so that when you click a link in a column of a row it will open up “mouse right-click” view in a separate pane.
- There will be single and bulk actions. Bulk actions can be executed only in the CART tab where it is possible to “remove all” and “remove selected” rows. This leads also to a meaningful separation of selecting and collecting. Selection should be understood so that the user clicks or touches one row which makes the row selected (or unselected with another click or touch). When user’s selection is marked by checking a checkbox, it will be defined as collecting it. Collecting/dismissing is done using the check marks.
- When the user wants to collect all rows of a (paginated) page, they can click checkbox in the first column: checking it makes all rows collected, and unchecking makes all rows uncollected. If there are rows collected before clicking the checkbox, all of the rows become collected i.e. uncollected rows become collected. But note that the checkbox make only one page collected!
- So how to collect all rows? Especially if the number of rows is large: for example let’s say 1000+ rows. IMO, the correct approach is to use Table tab menu where there should be options: “Insert all” and “Insert collected”. In the CART tab where the collected rows are visible, there will be only a mark that “All rows selected”, and there is no pagination because practically speaking going through so many pages is just not possible for humans.
- Different extreme cases where grouping should be used are
- “All rows selected” (as discussed)
- “No rows selected” (it is not a good practise to display nothing on page)
- “1000+ rows selected” (custom max. limit has bee reached)
Actual design of the table data part is show in the image. As said, there should be possibility to collect items (first column). Compared to many other designs the only new thing is the tabs, which is done because we don’t want to have Actions on rows at all.
There is still one unsolved issue: what if your SQL-query is a view using JOINs and having multiple million rows. In UI, humans can process only about 1-1000 rows. This means that result set size must be made smaller:
- There can be a Query builder that narrows down database query and therefore the result set as well: the more exact query, the less result set items
- It can be that the result set of the database query is still very large, for example tens of thousands of items. But since UI will still accept only a sample size of max. 1000 items the UI will display only “All” option
- Whenever the result set size, after making the discovery/search query more exact, is less than 1000 items, they are displayed in the UI
- When there are 1-1000 items in the result set, then they displayed in the UI as rows of the data table.
So we can say that there are three important parts:
- Database contains all rows
- Search function queries a subset of all rows
- Filter function can be used for exploring the subset
